The purpose of this exercise is to provide very basic manipulations
of a sine or cosine wave.
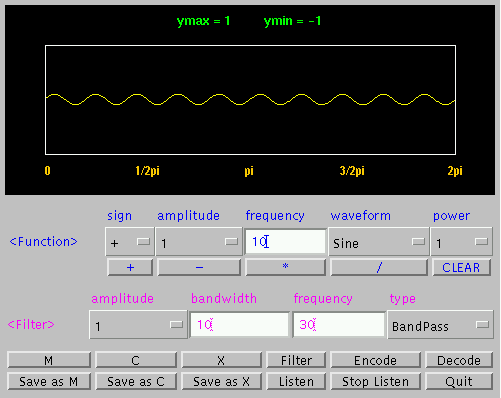
Figure 1 is a sine wave with amplitude of 1 and a frequency of 10 Hz.
You should have the following picture in your JAVA applet's
graph window.
Fig 1

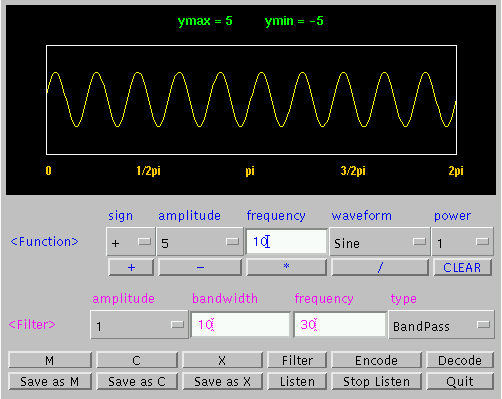
We can change the amplitude to see another sine wave.
The following wave form should be display on the JAVA applet.
Fig 2

As you can see, changing the amplitude only makes the Y component
large. The frequency and the period did not change for the sine
wave. You may say that amplitude determines the loudness of the
sine wave by its audio output.
After looking at the amplitude of a sine wave, let us turn
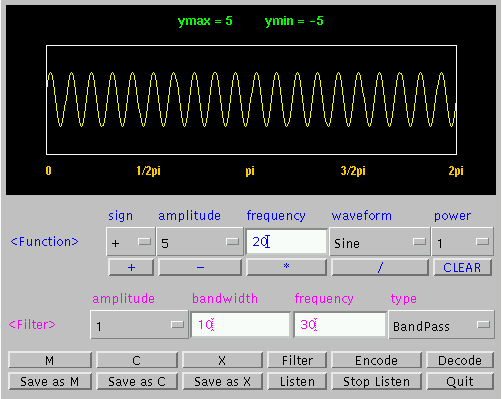
our attention to the frequency of the sine wave. Figure 3 is the
same as figure 2 but at a higher frequency.
Fig 2.

Compared to figure 2, there are more cycles per period in
figure 3. The frequency determines the number of cycles per time
in a wave. You may say how fast or slow the sine is moving. From
the audio outputs of figure 2 and figure 3, figure 3 has a slightly
higher pitch then figure 2. If one changes the sine wave at a
higher frequency, you may hear sounds that sound like a chipmunk.
You can give it at a try at a higher frequency if you like. Just
change the frequency in the frequency box of the JAVA applet and
redraw it. Please note that changing to a higher frequency will
take a longer time for the output of the graph. Please click below
to return to the table of contents when you are ready for the
next lesson.